Student Reports
With the Amplify OT Learning Platform, you can easily track and analyze your students’ progress using our comprehensive reporting tools.
Gradebook Feature
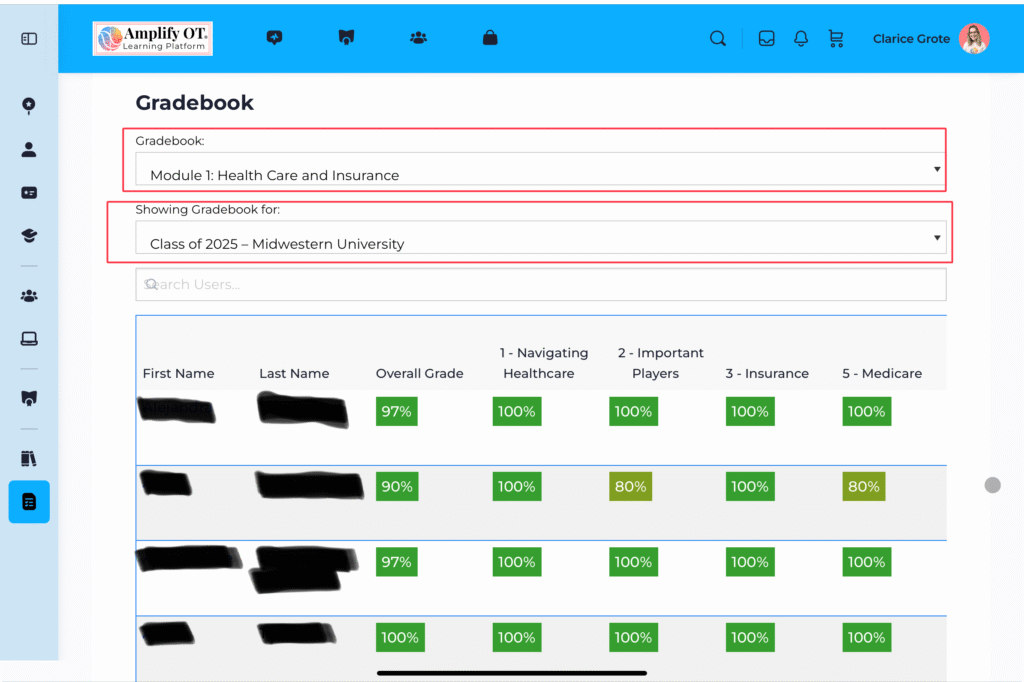
The Gradebook Feature is the easiest way to see student quiz completion and grades. It should meet most of your needs.
You can filter the gradebook by user and by Module. The grid below will show the student’s highest grade for each quiz.
Gradebook: Missing Quizzes
If the quiz is empty, it means the student has not yet attempted a quiz for that lesson.
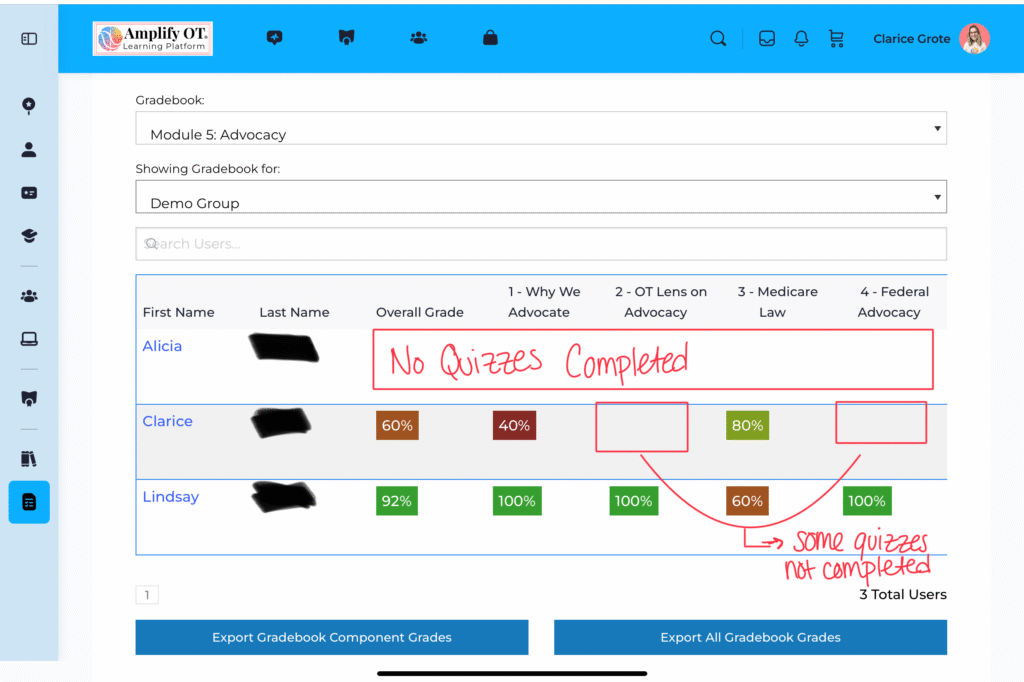
Quiz information can also be downloaded as a CSV file using the “Export Gradebook Component Grades” and “Export All Gradebook Grades” buttons, located below the gradebook. A CSV file can be opened in Excel or other similar programs.
Comprehensive Student Reports
Below the Gradebook, you will see a section titled “Sort and Export Student Data”
These reports are more comprehensive with a significant amount of information.
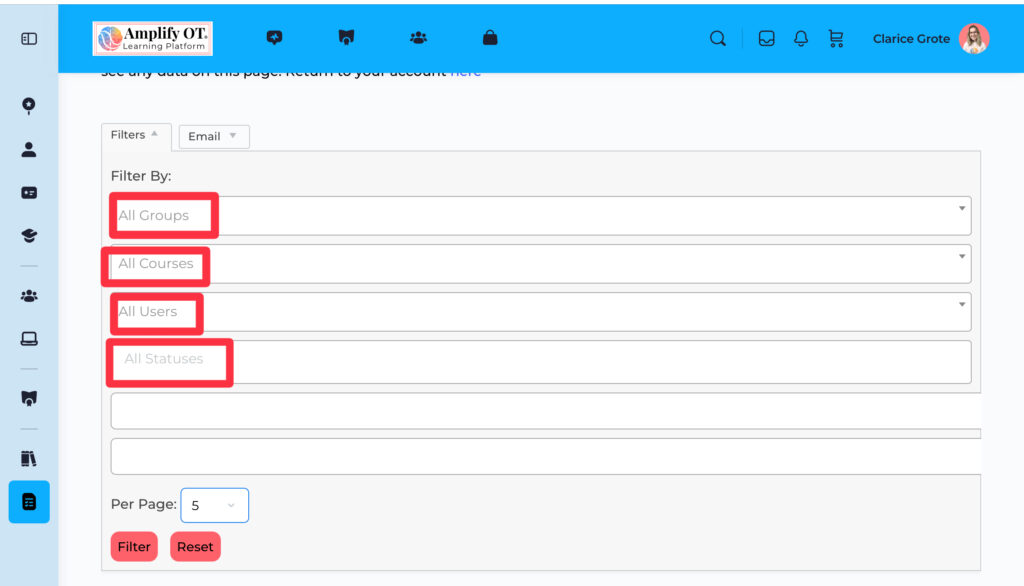
Filters
You can filter by group, courses, and users. You can also filter by completion status, such as “not started”, “in progress”, or “completed”.
With this dashboard, you can view course and quiz completion for courses that are not part of the Mastering OT Policy and Medicare Modules.
Course Progress and Student Activity
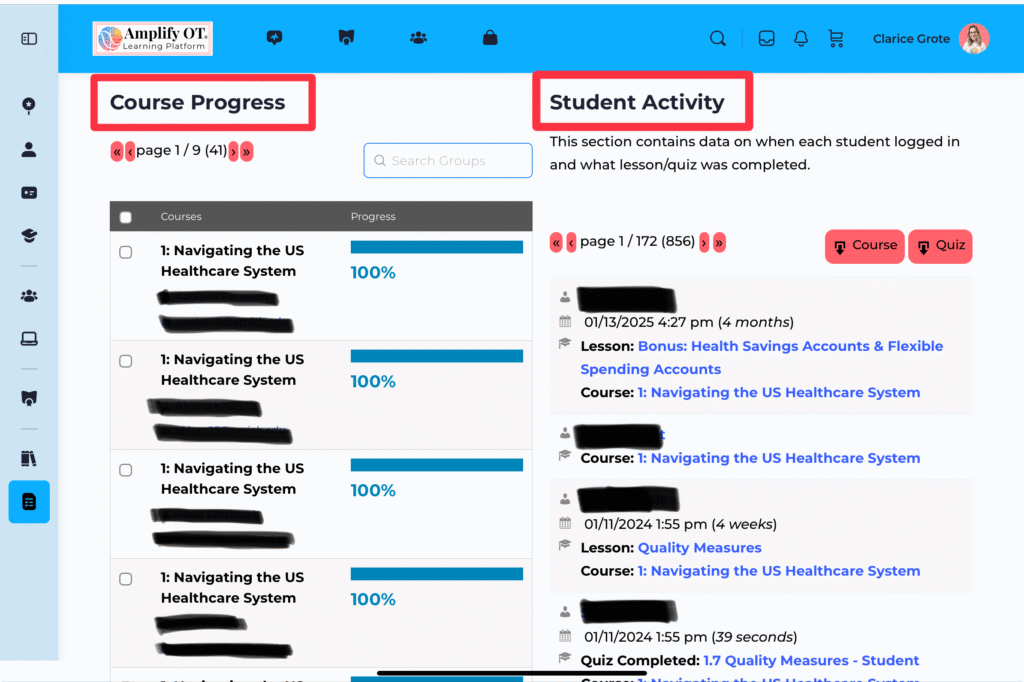
After applying your filters, two columns will populate with information.
Course Progress:
This section indicates the percentage of each course or module that the student has completed. A student must complete both the video and the quiz for a lesson to be marked as complete.
Student Activity:
This section indicates when and for how long a student accessed a lesson or quiz.
The quiz time is the most accurate. On average, it takes students 40 seconds to 1.5 minutes to complete the 5-question quiz. Shorter quiz times may indicate that a student was selecting answers at random.
The lesson and course access times are not very accurate, as they may count time when a user leaves their browser open – this is why it shows 4 months or 4 weeks for the users below.
Downloading Student Results
As with the gradebook, this information can be exported in a CSV file with course or quiz data using the red buttons shown under “Student Activity”.
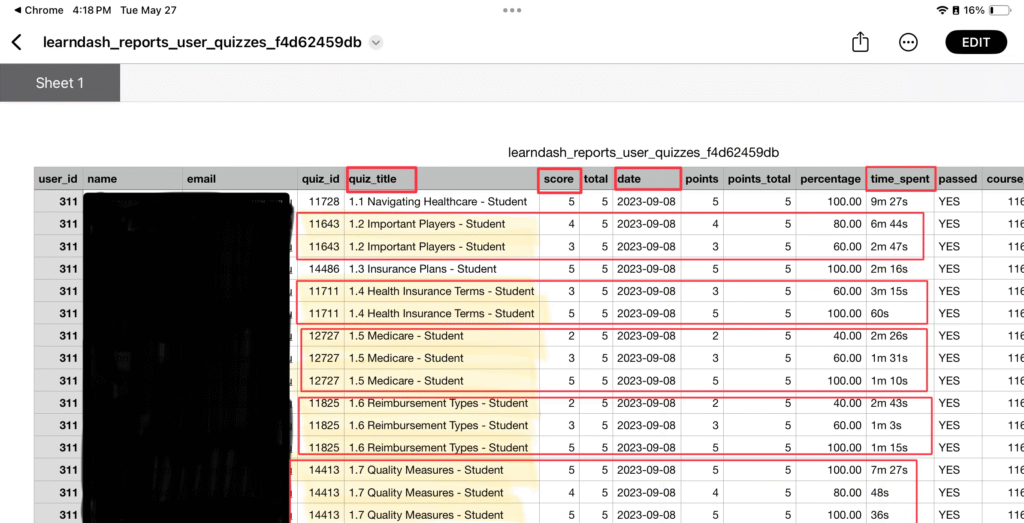
The Quiz CSV file will show every quiz attempt by each student, which can be overwhelming to view.
The screenshot below shows quiz attempts for a single student. You can see information on each quiz attempt, including quiz title, score, date, and time spent.
Viewing Student Answers for Quiz Attempt
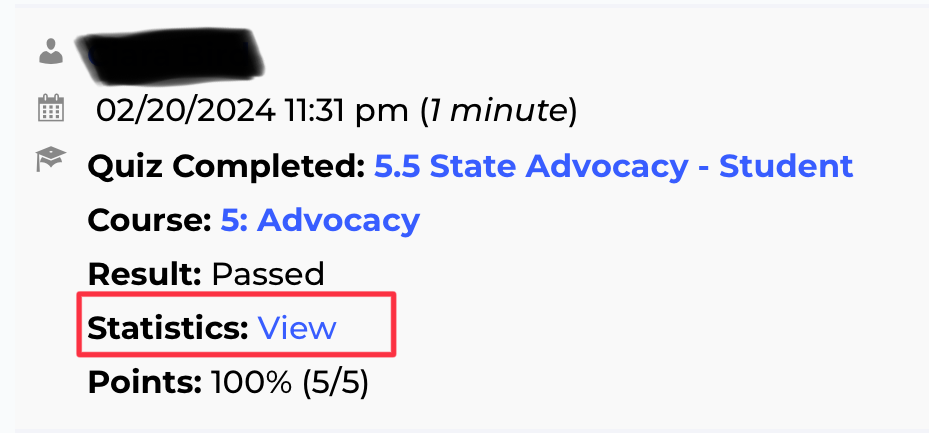
Under the “Student Activity” section, you may see the option to click “view” after a quiz is completed.
Although this feature is rarely used by faculty, the information is available to you. Typically, this data is most helpful when trying to determine where a student might be struggling.
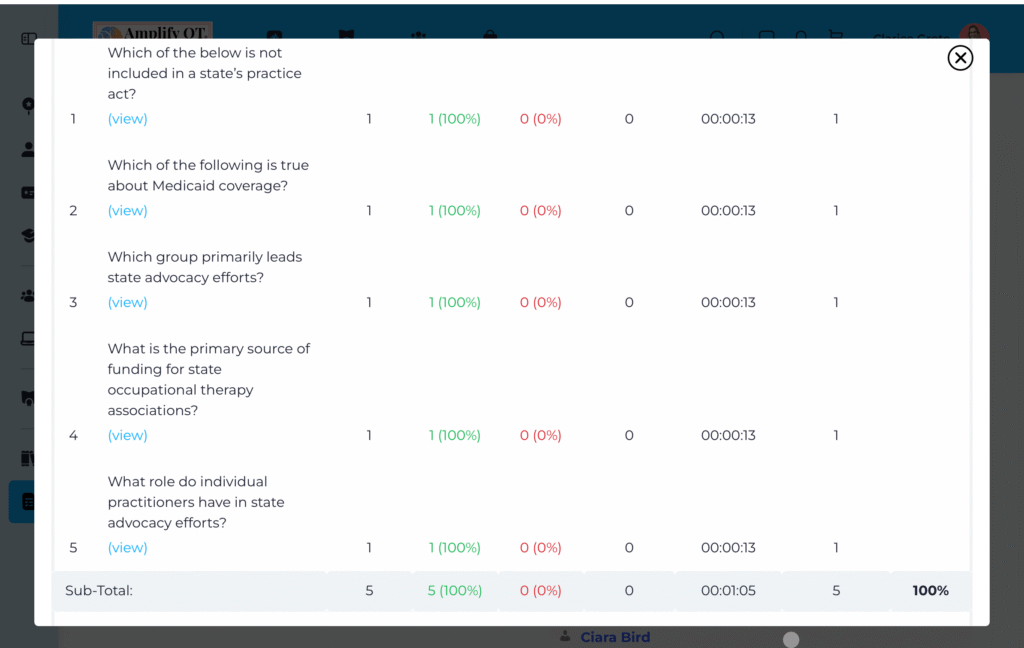
After clicking view, it will show you each question and indicate if the student got it correct or incorrect.
If you select “view” under the question, you can see which answer the student selected.
When a student attempts a quiz, they will be told which question they got wrong, but will not be told what the correct answer is.
Responses